Running a workflow
| Trigger | How to run |
|---|---|
| Manual | Click Run in the editor |
| Webhook | Send an authenticated HTTP request to the webhook URL shown on the Start node |
| Schedule | Runs automatically based on the cron expression you configured |
| App | Triggered when the connected app fires an event (e.g. new email) |
| Agent | Triggered via the AI agent chat sidebar |
| Chat | POST a chat message to the chat URL (or use the website widget). Sync replies return immediately; if the run waits (e.g. Lark card), the response includes pending: true and the widget polls for later operator replies |
Live execution on the canvas
While a run is active in the editor, the canvas streams live updates:
- Nodes highlight as they execute
- Status indicators show success, failure, waiting, or in-progress
- Click an executed node to open its Execution Data (input and output)
When the run finishes (or fails), open Execution History for a full debug view of that run—including timed replay.
Execution History
Execution History is a dedicated debug workspace for a single run. Open it from the workflow editor:
- Open the workflow.
- Go to the Executions tab (or open a run from the executions list).
- You land on
/workflows/{id}/execution/{executionId}with three panels:
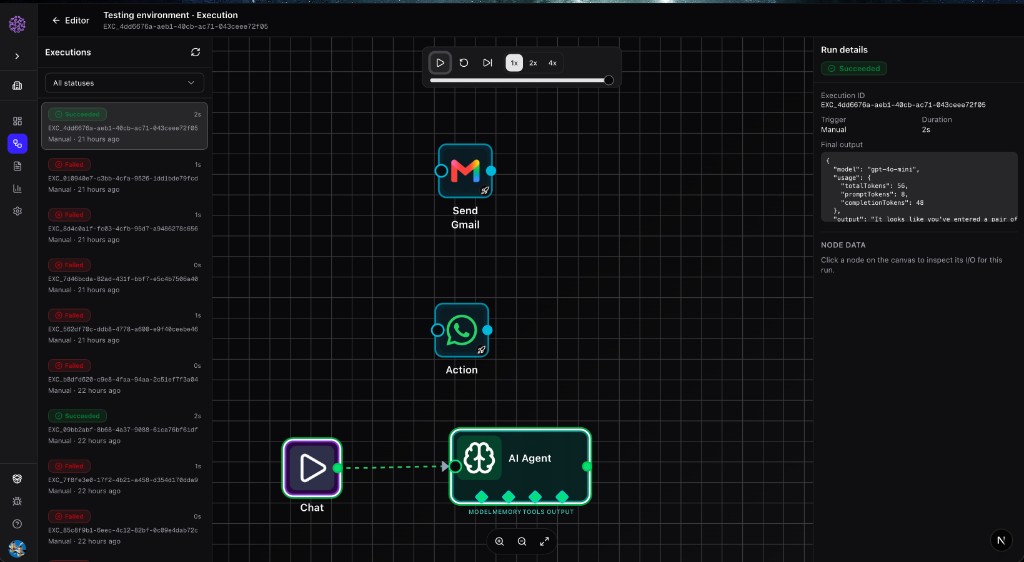 Execution History workspace — past runs on the left, snapshot canvas in the center, and Run details on the right
| Panel | What it shows |
|---|---|
| Left — Executions | Past runs for this workflow (status, trigger, duration). Filter by status and switch runs without leaving the page. |
| Center — Canvas | A snapshot of the graph as it was for that run, with success/failure trail on nodes. Not the live draft editor. |
| Right — Run details | Status, execution ID, trigger, duration, top-level error (if any), trigger input, final output, and selected-node I/O. |
Browse past runs
The left sidebar lists every run for the workflow. Status badges (Succeeded, Failed, and others) make failures easy to spot. Each row shows the execution ID, trigger type, relative time, and duration. Use All statuses to filter, then click a row to load that run’s canvas and details.
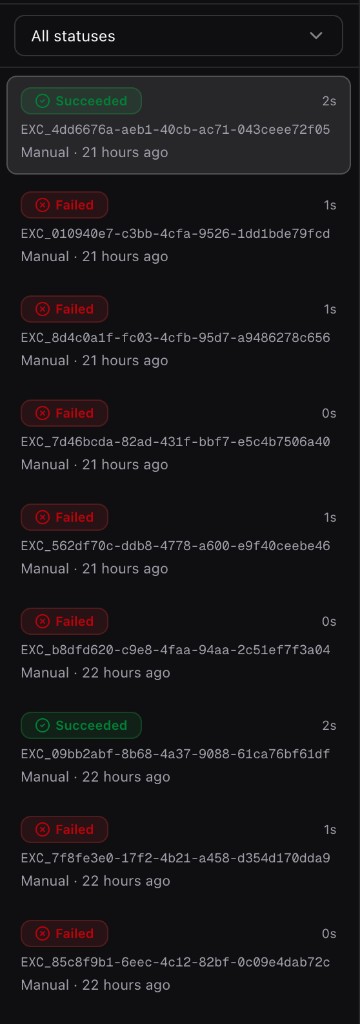 Executions list with Succeeded and Failed badges, trigger type, and duration
Live vs finished runs
- Live (
running,waiting,pending) — the canvas streams the current run. Replay controls show a Live badge until the run finishes. - Finished — a canvas snapshot and node timings unlock replay so you can step through what happened.
Replay a finished run
When timed logs are available, use the controls above the canvas:
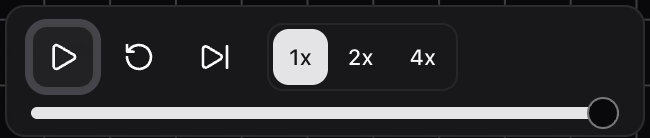 Replay controls — play, restart, jump to end, speed (1x / 2x / 4x), and timeline scrubber
- Play / Pause — animate the run along the timeline
- Restart — jump back to the start of the replay
- Jump to end — show the final trail immediately
- Speed —
1x,2x, or4x - Scrubber — seek to any point in the run
Long idle gaps between nodes may be compressed in the timeline so replay stays usable.
If you see “No timed node logs available for replay,” the run still has logs and node data in Run details, but timing data was not stored for animation.
Inspect errors and node data
- Check Run details for the overall status and any top-level Error payload.
- Click a node on the canvas (failed nodes are marked on the trail).
- The right panel shows that node’s input and output for this execution—use this to debug
{{template}}paths and bad payloads.
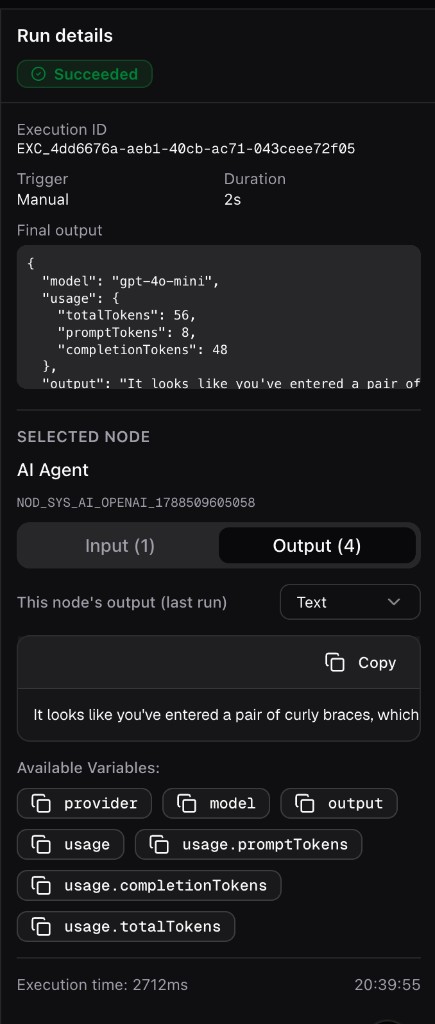 Run details with final output and a selected AI Agent node’s Output tab and available variables
You can also inspect node I/O from the editor after a live run via the node’s Execution Data tab; Execution History is better when you need the historical graph, side-by-side run list, or replay.
Rerun a failed or cancelled execution
From Run details (or the executions list), use Rerun on a failed or cancelled run. TogoFlow starts a new execution with the same trigger input. You are redirected to that new run’s Execution History page.
Cancelling a run
Long-running workflows (especially AI agent loops) can be cancelled from the execution UI. The workflow stops at the current node and the execution is marked cancelled. You can Rerun afterwards with the same input if needed.
Restart from a node
Restart from node is a graph configuration option (on Function / some Transform steps), not a debug “resume from failure” button.
When enabled, after that step finishes the engine jumps back to an earlier node (for scan/loop patterns) without drawing a back-edge on the canvas. See Transform and Loop for setup.
This is different from Rerun, which restarts the whole execution from the trigger.
Notifications
In Settings → Notifications, you can enable email and in-app alerts for workflow completed, failed, and long-running (still running) executions so you do not have to watch the canvas for every run.
Common issues
| Problem | Fix |
|---|---|
Node shows undefined in output | Open Execution History (or Execution Data); check upstream I/O and your {{template}} path |
| Failed AI / Action node | Click the failed node on the execution canvas; read the error in Run details or node output |
| Replay unavailable | Run may still be live, or older runs may lack timings—use Run details and node click instead |
| OAuth error on Action node | Reconnect the app via the auth prompt or Settings |
| AI node timeout | Reduce maxTokens, use a faster model, or simplify the prompt |
| Webhook not firing | Verify the URL, HTTP method, and authentication settings on the Start node |
| Chat widget not loading | Confirm Website widget is enabled, workflow is published, embed token is valid, and your origin is allowed |
| Chat stuck on holding reply | Check the waiting execution; ensure a later step uses Website Chat → Reply to Session |
| Function node error | Check the error in Execution History node data; ensure your code returns a value |
Import and export
Share workflows with your team using Import / Export in the workflow header. Exported files are encrypted. This is useful for:
- Backing up workflows
- Moving automations between organizations
- Sharing templates without exposing credentials (credentials are not included in exports)